About this model
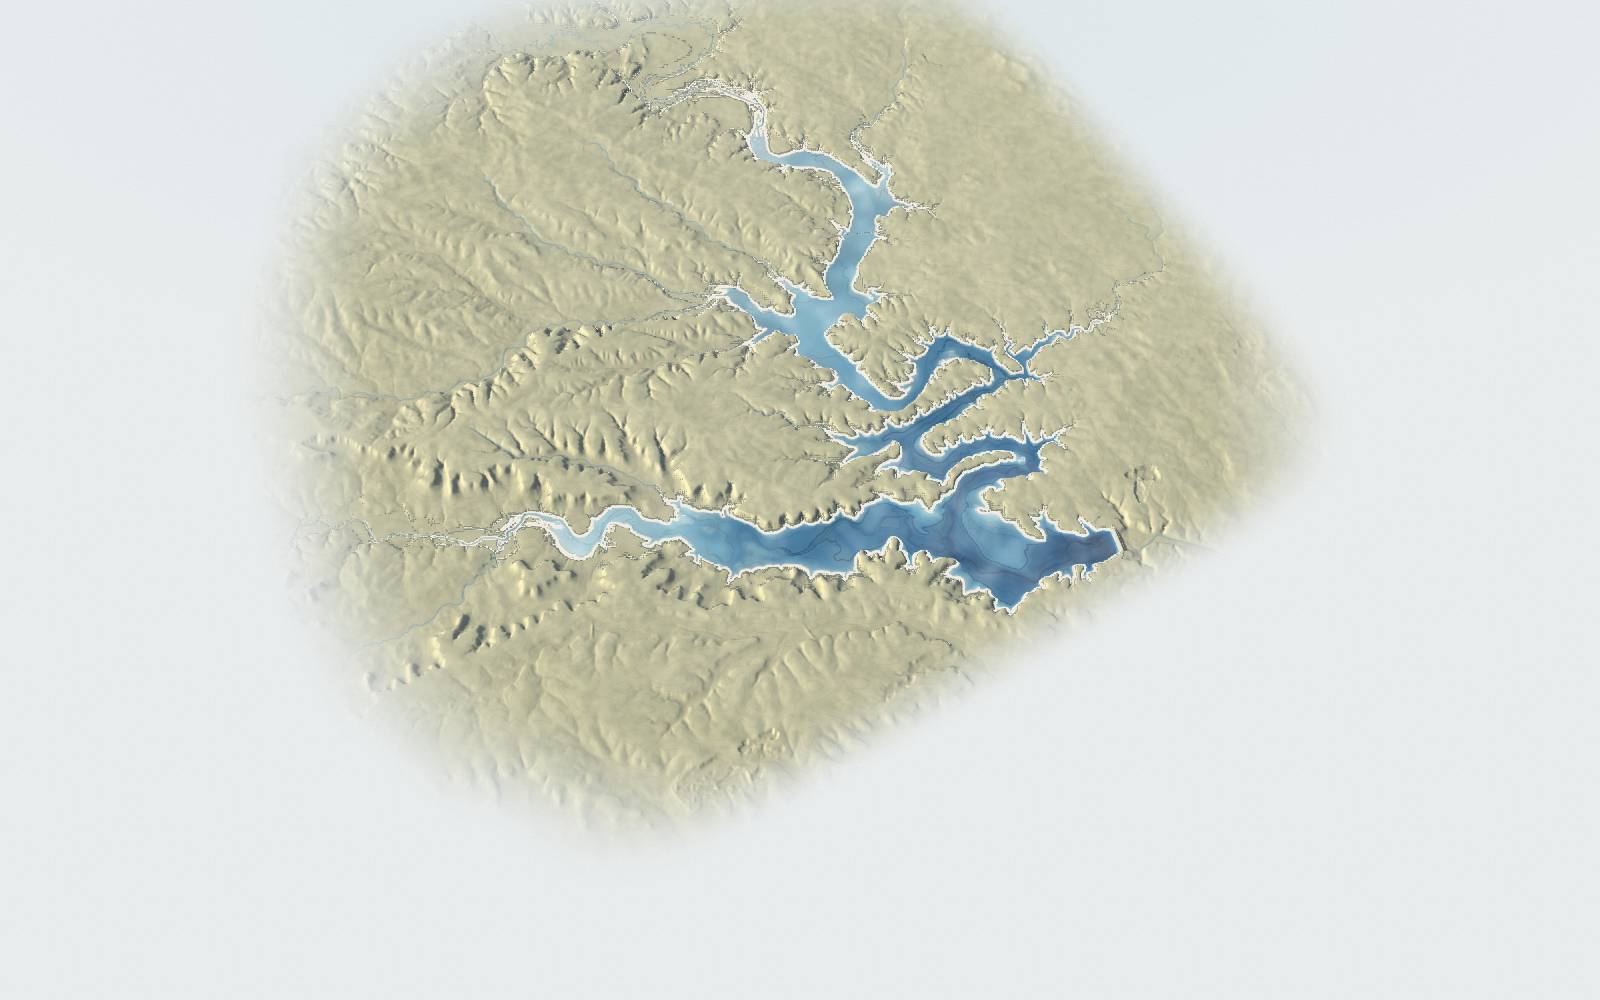
A relief model of Belton Lake built from a lakebed survey and a land elevation model. The water is drawn as a level surface at the selected elevation. Slide "Look through the water" toward Lakebed, or press and hold on the lake, to see the surveyed lakebed under it.
Map keyBoat rampMarinaPark or trailDam and intake towerRoad
How deep is Belton Lake? The lowest point of the lakebed in the Texas Water Development Board’s 2015 survey is 483.7 ft above sea level, about 110 ft below the surface when the lake is full at 594 ft. Hover over the water, or tap it, to read the depth at any point.
What is drawn to scale
- Horizontal distances, the shape of the lakebed and the surrounding land, from the elevation grids listed below (17 m cells at full detail).
- Key levels:
- Top of dam: 662 ft. Source: TWDB 2015 report, Table 1.
- Record high: 634.36 ft, March 6, 1992. Source: USACE Water Control Manual.
- Flood pool top / spillway crest: 631 ft. Source: TWDB 2015 report, Table 1.
- 2007 flood peak: 629.64 ft, 2007. Source: USACE Water Control Manual.
- July 2025 flood peak: 602.12 ft, July 16, 2025. Source: USGS 08102000 daily mean.
- Conservation pool (full): 594 ft. Source: TWDB 2015 report, Table 1.
- Lowest since 2000: 574.64 ft, October 22, 2023. Source: USGS 08102000 daily mean.
- Lowest lakebed (TWDB 2015): 483.70 ft. Source: TWDB 2015 survey DEM minimum and first row of the elevation-area-capacity table.
- Daily levels from 1990 (USGS gauge 08102000 via api.lakebelton.com). Daily levels for October 1991 to September 1995, missing from the USGS daily values, are the U.S. Army Corps of Engineers Fort Worth District's midnight readings for the same gauge, checked against the USGS annual Water Resources Data reports for those years. The record high, 634.36 ft on March 6, 1992, is the cited peak; the highest daily reading is 634.34 ft.
- Storage, surface area and "acres of lakebed exposed" up to 594.2 ft come from the TWDB 2015 survey table; exposed acres are the area at 594 ft minus the area at the level shown. Areas above that are estimated from the terrain model and run 1 to 4% above the Corps of Engineers table. Percent full is storage as a share of storage at the conservation pool.
- Elevations are in feet above sea level (NGVD29), the datum of the lake gauge. The lakebed is the 2015 sonar survey, so sediment since then is not shown. Upstream of the survey, the Leon River and Cowhouse Creek channels are flat in the land data (they were mapped as water), so the model does not show their true beds.
What is illustrative
- Heights are exaggerated (2× unless you change it) so the hills and lakebed read clearly. Horizontal distances are true.
- Land colours (grass, juniper, rock) are drawn from slope and the direction a slope faces, not mapped vegetation. The light, the paper edge and the water colour are artistic.
- The waves are illustrated from the latest wind reading (its speed and direction) and the open-water distance the wind blows across to reach each part of the lake at the level shown, using the fetch-limited wave relations of the U.S. Army Corps of Engineers Shore Protection Manual (1984), with water close under a high windward bank drawn calmer. They are not a forecast, and wave heights are not shown. One reading is used for the whole lake; the Temple airport reading is taken away from the lake, so the wind over the water can differ. A reading without a direction is drawn with no sheltered shores. For past days there is no wind record here, so the water is drawn in a light breeze.
- The water surface is flat. Real lakes tilt a little when rivers run high. Water above the conservation pool (flood storage) is drawn a greyer blue.
- Above the spillway crest (631 ft), water running over the spillway and down its channel is drawn as an illustration. Its course follows the land model; its width, depth and flow are not modelled.
- "Look through the water" fades the water surface to show depth below it, coloured from the TWDB 2015 lakebed survey. Depth contours are every 10 ft (every 5 ft when zoomed in).
- The satellite layer is a photo from July 2022, when the lake stood near 588 ft. Its water is from that day; the blue drawn over it is the level you select. Below about 588 ft the model draws the surveyed lakebed instead of the photo's water.
- Belton Dam is drawn from lidar measurements of its crest and side slopes (USGS 3DEP, 2011). Its cited top of dam is 662.0 ft and its top width 30 ft (TWDB 2015, Table 1); the lidar puts the road on the crest 662.0 to 665.4 ft. The painted lane lines, the intake tower's size and its service bridge are drawn schematically.
- The SH 36 (TX 36) bridge is drawn at its measured end heights (USGS 3DEP, 640.34 and 639.89 ft), straight between them, 84 ft wide, with 32 spans of 120 ft (TxDOT bridge inventory). Its piers are laid out at that spacing, not surveyed, and the deck depth is a visual choice.
- Close up, depth contours are drawn from a finer grid of the same TWDB 2015 lakebed survey.
Sources
- TWDB Volumetric and Sedimentation Survey of Belton Lake (2015) twdb.texas.gov
- USGS 3D Elevation Program bare-earth DEM (dynamic ImageServer) elevation.nationalmap.gov
- OpenStreetMap via the Overpass API openstreetmap.org
- USACE Fort Worth District, Water Control Manual, Appendix 3: Belton Dam and Lake (September 2015) water.usace.army.mil
- USGS 08102000 Belton Lk nr Belton, TX (daily values) waterdata.usgs.gov
- USACE Fort Worth District, Corps Water Management System, Belton Lake daily elevation (BLNT2), October 1991 to September 1995, checked against USGS Water Resources Data, Texas, Water Years 1992 to 1995, Volume 2 cwms-data.usace.army.mil
- Wind: the Temple airport (KTPL) weather report from the NOAA Aviation Weather Center when a recent one is available, otherwise USGS 08102000 wind speed and direction (parameters 00035 and 00036), via api.lakebelton.com /api/all waterdata.usgs.gov aviationweather.gov
- Wave method: U.S. Army Corps of Engineers, Coastal Engineering Research Center, Shore Protection Manual, 4th edition (1984), Volume I, Chapter 3 (deep-water, fetch-limited wave growth and the averaging of fetch radials)
- api.lakebelton.com /api/history and /api/all api.lakebelton.com
- Belton Dam in detail: the dam page has a full 3D model of the dam, its gates and outlet. lakebelton.com/dam
- Bridge, dam crest road and service bridge lines: © OpenStreetMap contributors (ODbL). Bridge spans and width: TxDOT Bridges (SNBI), TxDOT Bridge Division. Dam and bridge heights: USGS 3D Elevation Program.
- Place descriptions and links: lakebelton.com place pages and the Belton Dam page.
- Roads, waterways, place names and dam outline © OpenStreetMap contributors (ODbL), openstreetmap.org/copyright; Land elevation: U.S. Geological Survey 3D Elevation Program (3DEP), public domain; Lakebed: Texas Water Development Board, 2015 Volumetric and Sedimentation Survey of Belton Lake; Lake levels: USGS 08102000 / USACE Fort Worth District via api.lakebelton.com
- Imagery: NAIP imagery provided by USDA Farm Service Agency (2022). USDA National Agriculture Imagery Program (NAIP) 2022, Texas, 60 cm, 4-band (RGB + NIR) orthoimagery. Public domain (US federal government work).